

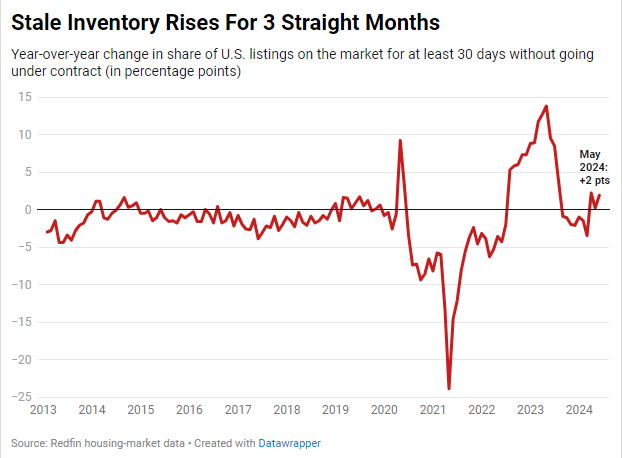
More homes are sitting on the market for at least 30 days without going under contract, as homebuying demand falters in the face of high housing costs.
More than three in five (61.9%) homes that were on the market in May had been listed for at least 30 days without going under contract. That’s up from 60% one year earlier and roughly 50% two years earlier.
The share of homes sitting on the market for at least one month has been increasing year over year since March, when growth in new listings accelerated but demand from buyers remained tepid, as it has been since mortgage rates started rising in 2022. More homes for sale paired with slow demand means that less-desirable listings are piling up, leaving some of them without a buyer.
This is according to an analysis of Redfin’s housing-market data, which goes back through 2012. The inventory data in this report includes homes that were on the market for at least 30 days, or at least 60 days, without going under contract and were actively listed on the final day of the month. The share of homes sitting for at least 30 (or 60) days is seasonal; it typically peaks in the winter and troughs in the spring–which is why the charts in this report focus on year-over-year changes.
Stubbornly high mortgage rates and record-high home prices have priced out many homebuyers, tempering demand even at a time of year when the housing market is typically warming up. The average 30-year fixed mortgage rate is 6.99%, more than double the pandemic-era low and just slightly below October 2023’s two-decade high of 7.8%. The median U.S. monthly housing payment is just about $30 shy of its record high.
Redfin agents report that move-in ready homes in desirable neighborhoods are still selling quickly, but listings that don’t fit that bill are starting to pile up in some parts of the country.
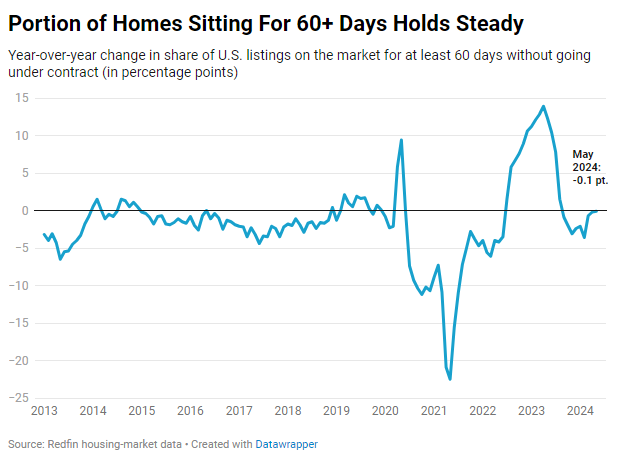
Two in five listings are sitting on the market for 60 days or more
Two in five (40.1%) homes that were on the market in May had been listed for at least two months without going under contract. That’s unchanged from a year earlier and up from 27.8% two years earlier.
The share of homes sitting on the market for at least 60 days was essentially flat year over year in both April and May. Before that, the metric had posted annual declines since last September. The share of homes sitting for at least 60 days is likely to start increasing next month so long as mortgage rates stay high, according to Redfin economists.
Metro-level highlights: Unsold inventory, May 2024
The share of inventory sitting on the market for 30-plus days is growing fastest in Dallas. Just over 60% of Dallas listings that were on the market in May had been listed for at least 30 days, up from 53% a year earlier. Next come three Florida metros: Fort Lauderdale (75.5%, up from 68.2%), Tampa (68.7%, up from 61.9%) and Jacksonville (69.2%, up from 62.9%). Inventory is growing stale fast in Texas and Florida largely because those states are building far more homes than anywhere else in the country, contributing to rising supply, and because some homebuyers are nervous about the increasing prevalence of natural disasters.
On the other end of the spectrum, the share of homes sitting on the market for at least 30 days has declined most in Seattle (41.2%, down from 50.5%), Las Vegas (55.9%, down from 63.9%) and San Jose, CA (34.4%, down from 42.2%).
| Metro-level summary: Unsold inventory, May 2024
50 most populous U.S. metros Share of listings sitting on the market for at least 30 days without going under contract, ranked from biggest year-over-year increase to biggest decline (in percentage points) |
||
| U.S. metro area | Share of unsold listings sitting on the market for at least 30 days | Share of unsold listings sitting on the market for at least 30 days, YoY change (in percentage points) |
| Dallas, TX | 60.5% | 7.5 |
| Fort Lauderdale, FL | 75.5% | 7.3 |
| Tampa, FL | 68.7% | 6.8 |
| Jacksonville, FL | 69.2% | 6.3 |
| Fort Worth, TX | 61.9% | 5.0 |
| Orlando, FL | 67.0% | 4.9 |
| San Antonio, TX | 68.4% | 4.5 |
| West Palm Beach, FL | 75.6% | 4.3 |
| Kansas City, MO | 59.4% | 2.8 |
| Miami, FL | 76.3% | 2.7 |
| Portland, OR | 56.8% | 2.3 |
| Oakland, CA | 43.8% | 2.1 |
| Sacramento, CA | 49.9% | 2.1 |
| Columbus, OH | 45.8% | 1.7 |
| Phoenix, AZ | 64.5% | 1.7 |
| San Diego, CA | 47.5% | 1.6 |
| Atlanta, GA | 61.0% | 1.3 |
| Minneapolis, MN | 49.9% | 1.0 |
| Riverside, CA | 60.6% | 0.9 |
| Austin, TX | 66.0% | 0.5 |
| Houston, TX | 64.4% | 0.5 |
| Virginia Beach, VA | 47.7% | 0.3 |
| Los Angeles, CA | 58.2% | -0.1 |
| Charlotte, NC | 58.2% | -0.8 |
| Detroit, MI | 58.8% | -1.1 |
| St. Louis, MO | 54.1% | -1.5 |
| Indianapolis, IN | 53.8% | -1.7 |
| Philadelphia, PA | 65.1% | -1.9 |
| Denver, CO | 49.9% | -2.1 |
| Nashville, TN | 60.6% | -2.2 |
| Boston, MA | 41.1% | -2.4 |
| Nassau County, NY | 53.6% | -2.7 |
| Newark, NJ | 50.9% | -2.8 |
| Providence, RI | 41.5% | -2.9 |
| Pittsburgh, PA | 59.7% | -3.0 |
| San Francisco, CA | 55.2% | -3.1 |
| Warren, MI | 45.9% | -3.1 |
| Cincinnati, OH | 49.6% | -3.1 |
| New York, NY | 66.5% | -3.3 |
| Milwaukee, WI | 42.7% | -3.4 |
| Anaheim, CA | 47.0% | -3.5 |
| Chicago, IL | 53.4% | -3.6 |
| Cleveland, OH | 50.7% | -3.9 |
| Washington, DC | 50.5% | -3.9 |
| Baltimore, MD | 51.6% | -4.3 |
| New Brunswick, NJ | 54.1% | -5.2 |
| Montgomery County, PA | 45.0% | -5.9 |
| San Jose, CA | 34.4% | -7.8 |
| Las Vegas, NV | 55.9% | -8.0 |
| Seattle, WA | 41.2% | -9.3 |
This post was originally published on 3rd party website mentioned in the title of this site